
Welcome back to Virvijay.com, where you learn Power BI the right way! 🚀
If your Power BI reports are dealing with millions of rows, they can get very slow. But don’t worry! Aggregations can speed up your reports while keeping the data accurate.

In this blog, you’ll learn:
- ✅ What Power BI Aggregations are.
- ✅ How Aggregations improve performance.
- ✅ Step-by-step guide to set up Aggregations.
- ✅ Best practices to make your reports run faster.
1️⃣ What Are Power BI Aggregations?
- 🔹 Aggregations allow Power BI to store summary data while keeping access to detailed data when needed.
- 🔹 Instead of running calculations on millions of rows, Power BI can pre-calculate totals and averages.
- 🔹 This makes reports MUCH faster and reduces memory usage.
🚀 Example:
A sales dataset has 100 million rows. Instead of loading everything, we create an aggregated table that stores:
- ✔️ Total Sales per Region
- ✔️ Total Sales per Product
- ✔️ Total Sales per Month
Now, Power BI first looks at the aggregated table. If a user needs detailed data, it fetches only the required rows instead of scanning millions.
2️⃣ How Aggregations Improve Performance
Aggregations reduce the number of rows Power BI processes, making reports 10x faster!
🔹 Without Aggregations: Power BI scans all 100 million rows for calculations.
🔹 With Aggregations: Power BI scans only pre-summarized data (e.g., 100,000 rows).
🚀 Performance Boost:
- ✔️ Faster visuals and calculations.
- ✔️ Less memory usage.
- ✔️ Faster data refresh times.
3️⃣ Setting Up Aggregations in Power BI
Let’s create an aggregated table step by step.
Step 1: Load Your Large Dataset
- 1️⃣ Open Power BI Desktop.
- 2️⃣ Load a dataset with millions of rows (e.g., Sales Data).
Step 2: Create an Aggregation Table
- 1️⃣ Click Modeling → New Table.
- 2️⃣ Use DAX to create a summarized table:
DAX
Sales_Aggregated =
SUMMARIZE(
Sales,
Sales[Region],
Sales[Product],
"Total Sales", SUM(Sales[Amount])
)
- 3️⃣ This table now contains total sales per region and product instead of row-level details.
Step 3: Define Aggregations
- 1️⃣ Go to Model View.
- 2️⃣ Click on Sales_Aggregated Table.
- 3️⃣ Click Manage Aggregations.
- 4️⃣ Map the columns:
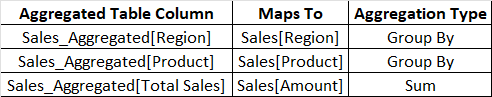
- 5️⃣ Click OK.
🚀 Now, Power BI will use the Aggregated Table whenever possible!
Step 4: Set Storage Mode to Dual or Import
- 1️⃣ Open Model View.
- 2️⃣ Select the Aggregated Table.
- 3️⃣ Change Storage Mode to Import or Dual.
- 🔹 Dual Mode: Keeps data in both memory & DirectQuery, optimizing performance.
- 🔹 Import Mode: Loads pre-summarized data into memory for fastest performance.
4️⃣ Testing Aggregations in Power BI
- After setting up aggregations, test if Power BI is using them.
Step 1: Open Performance Analyzer
- 1️⃣ Go to View → Performance Analyzer.
- 2️⃣ Click Start Recording and interact with visuals.
Step 2: Check Query Plan
- 1️⃣ In Performance Analyzer, check if Power BI is hitting the Aggregation Table.
- 2️⃣ If yes, your report is running WAY faster! 🚀
5️⃣ Best Practices for Power BI Aggregations
- ✔️ Use Aggregations for Large Datasets – If your dataset has millions of rows, use aggregations to pre-summarize data.
- ✔️ Choose the Right Aggregation Type – Use SUM, COUNT, MIN/MAX, or AVG depending on what you need.
- ✔️ Use Dual Storage Mode – This allows Power BI to decide whether to use memory or DirectQuery.
- ✔️ Optimize Queries Before Aggregations – Remove unnecessary columns and rows before aggregating.
- ✔️ Test Performance Regularly – Always check Performance Analyzer to ensure aggregations are being used.
6️⃣ Conclusion: Make Your Power BI Reports 10x Faster!
By using Aggregations, you can:
- ✅ Speed up Power BI reports.
- ✅ Reduce memory usage.
- ✅ Improve user experience with fast-loading visuals.
- ✅ Handle millions of rows efficiently.
7️⃣ What’s Next?
📌 In the next blog, you’ll learn:
- ✅ How to use Power BI Composite Models.
- ✅ Best practices for Hybrid Tables.
- ✅ When to use Import vs DirectQuery Mode.
🔔 Stay tuned to Virvijay.com for more Power BI tutorials!
💬 Got questions? mail support@virvijay.com

.jpg)


