Welcome back to Virvijay.com, your go-to place for mastering Power BI! 🎯
In our last blog, we explored SUMX and AVERAGEX, two powerful DAX functions for row-level calculations. Today, we’re tackling an important question that confuses many Power BI users:
💡 Should you use Calculated Columns or Measures in Power BI?
Choosing the right approach can boost your report performance and optimize memory usage. Let’s break it down!
1️⃣ What Are Calculated Columns and Measures?
In Power BI, both Calculated Columns and Measures are used to create new values from existing data. But they serve different purposes.
- ✔ Calculated Columns → Add new data at the row level
- ✔ Measures → Perform calculations at the visualization level
2️⃣ What is a Calculated Column?
A Calculated Column is a new column added to a table using a DAX formula. It stores values in the data model and behaves like any other column in your dataset.
👉 Example: Creating a Full Name Column
DAX
Full Name = Customers[First Name] & " " & Customers[Last Name]
📌 Where It’s Used:
- ✔ Filtering and grouping
- ✔ Sorting data
- ✔ Establishing relationships between tables
3️⃣ What is a Measure?
A Measure is a dynamic formula that calculates values based on user selections in a report. Unlike calculated columns, measures don’t store data – they compute values on demand.
Example: Total Sales Calculation
DAX
Total Sales = SUM(Sales[Amount])
📌 Where It’s Used:
- ✔ Aggregating data (SUM, COUNT, AVERAGE)
- ✔ Creating dynamic calculations
- ✔ Improving performance
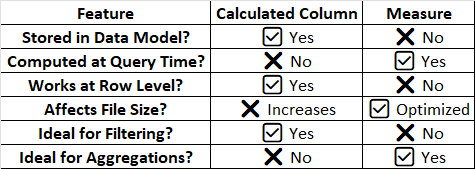
4️⃣ Key Differences Between Calculated Columns and Measures
5️⃣ When to Use Calculated Columns?
🚀 Use Calculated Columns When:
- ✔ You need a new column to filter or sort data.
- ✔ You need to create relationships between tables.
- ✔ The calculated value is always the same (not dependent on user selections).
📌 Example 1: Categorizing Sales as High or Low
DAX
Sales Category = IF(Sales[Amount] > 10000, "High", "Low")
📌 Example 2: Extracting Year from a Date
DAX
Sales Year = YEAR(Sales[Order Date])
6️⃣ When to Use Measures?
🚀 Use Measures When:
- ✔ You need calculations that change based on filters and slicers.
- ✔ You want to improve performance (measures don’t increase file size).
- ✔ You need to create aggregations (SUM, AVERAGE, COUNT, etc.).
📌 Example 1: Calculating Total Profit
DAX
Total Profit = SUM(Sales[Revenue]) - SUM(Sales[Cost])
📌 Example 2: Calculating Average Order Value (AOV)
DAX
Average Order Value = DIVIDE(SUM(Sales[Revenue]), COUNT(Sales[Order ID]))
7️⃣ Performance Optimization: Why Measures Are Better Than Calculated Columns?
- ✔ Calculated Columns take up memory space because they are stored in the model.
- ✔ Measures are calculated only when needed, reducing data load.
📌 Example: Instead of using a Calculated Column for Profit, use a Measure:
❌ BAD (Using a Calculated Column)
DAX
Profit = Sales[Revenue] - Sales[Cost]
✔ GOOD (Using a Measure)
DAX
Total Profit = SUM(Sales[Revenue]) - SUM(Sales[Cost])
📌 Result: Measure is faster and more optimized! 🚀
8️⃣ Common Mistakes to Avoid
🚨 Mistake #1: Using Calculated Columns for Aggregations
- ❌ Example: Creating a column for Total Sales = Sales[Quantity] * Sales[Price]
- ✔ Better Solution: Use a Measure → SUMX(Sales, Sales[Quantity] * Sales[Price])
🚨 Mistake #2: Using Measures for Static Calculations
- ❌ Example: Creating a measure for Sales Year = YEAR(Sales[Date])
- ✔ Better Solution: Use a Calculated Column → YEAR(Sales[Date])
🚨 Mistake #3: Adding Too Many Calculated Columns
- ❌ Example: Creating multiple columns for different price categories
- ✔ Better Solution: Use DAX Measures and Filters
9️⃣ Conclusion: Which One Should You Use?
- ✔ Use Calculated Columns for static, row-level data like categories, relationships, and filters.
- ✔ Use Measures for dynamic calculations that change based on user selections.
- ✔ For performance optimization, prefer Measures whenever possible.
🚀 By making the right choice, you can build faster and more efficient Power BI reports!
🔔 What’s Next?
📌 In the next blog, we’ll cover:
- ✅ Understanding Row Context vs. Filter Context in DAX
- ✅ How to Use CALCULATE for Advanced Filtering in Power BI
- ✅ DAX Optimization Tips for Large Datasets
🔔 Stay tuned to Virvijay.com for more Power BI tutorials!
📩 For any queries, reach out to support@virvijay.com
💬 Got questions? Drop them in the comments!
What is Power BI? Beginner’s guide
How to create a dashboard in Power BI
Power BI vs Excel: Which one to use?
Best Power BI visualizations for reporting
Power BI DAX functions explained
Learn Power BI online free (step-by-step)
Power BI for data analysis: Complete guide
How to connect Power BI with Excel
Power BI vs Tableau: Which is better?
Top 5 Power BI projects for beginners


